Australia Is Not Just in Government Debt.
Australia Is a Debt Civilisation.
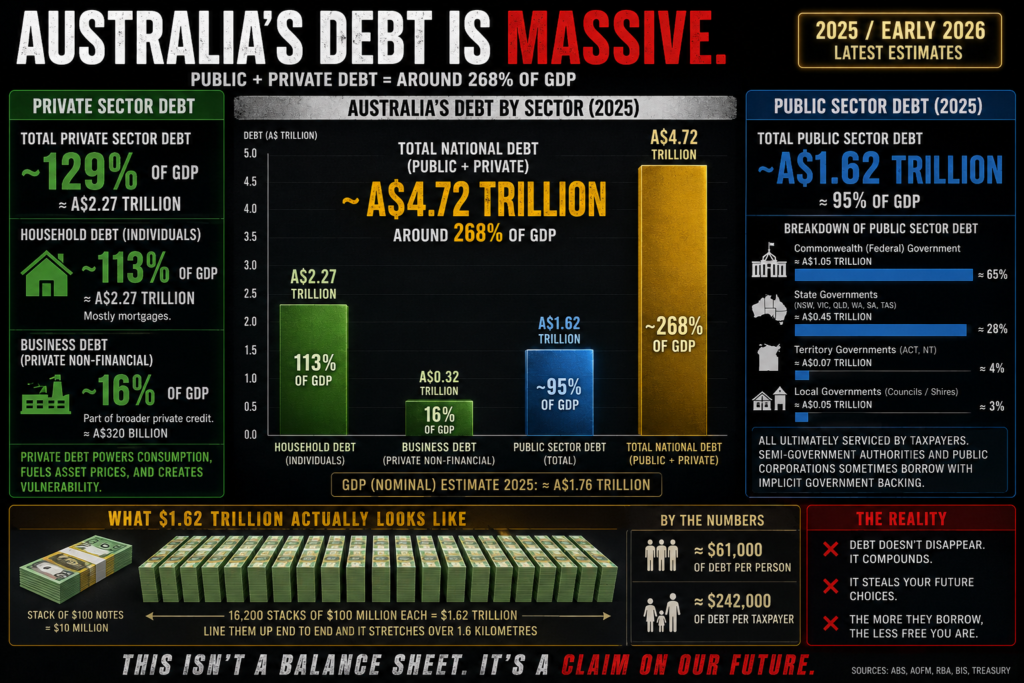
Public debt is only the headline. The deeper problem is the combined debt machine: government borrowing, household mortgages, business credit, state liabilities, council debt, public corporations and the quiet assumption that the taxpayer will carry it.
Private Debt
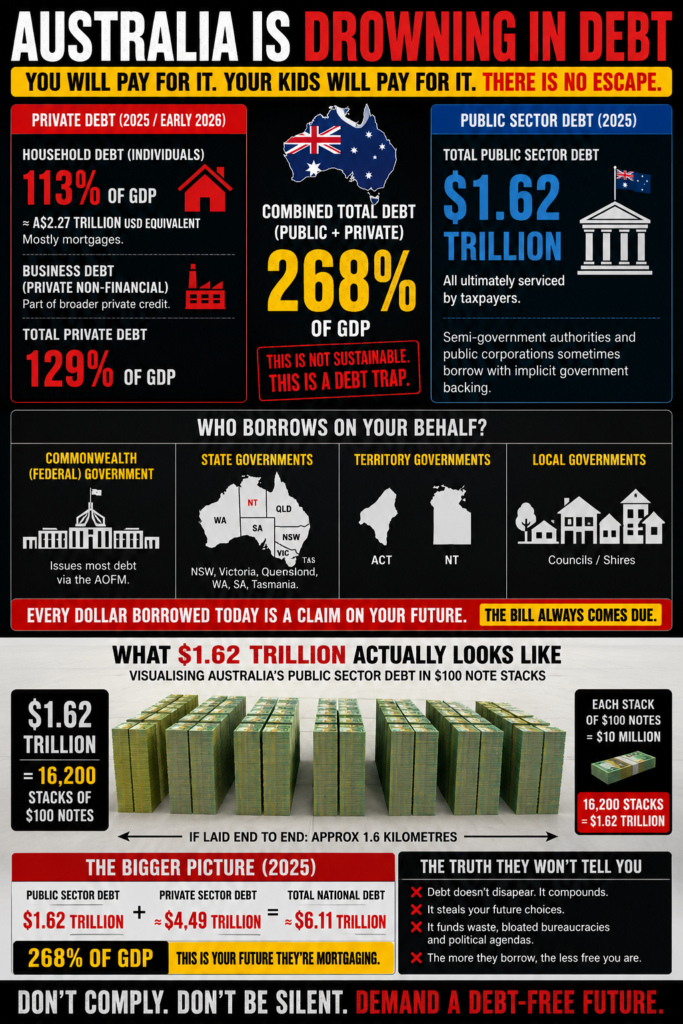
Household debt sits around 113% of GDP. Most of it is mortgage debt: ordinary Australians borrowing against shelter just to participate in the economy.
~129% of GDP
Total private-sector debt estimate, 2025 / early 2026.
Public Debt
Commonwealth, state, territory and local government borrowing forms the public debt stack. It does not disappear because it is issued through different bodies.
~$1.62 Trillion
Approximate total public-sector debt, 2025.
Combined Burden
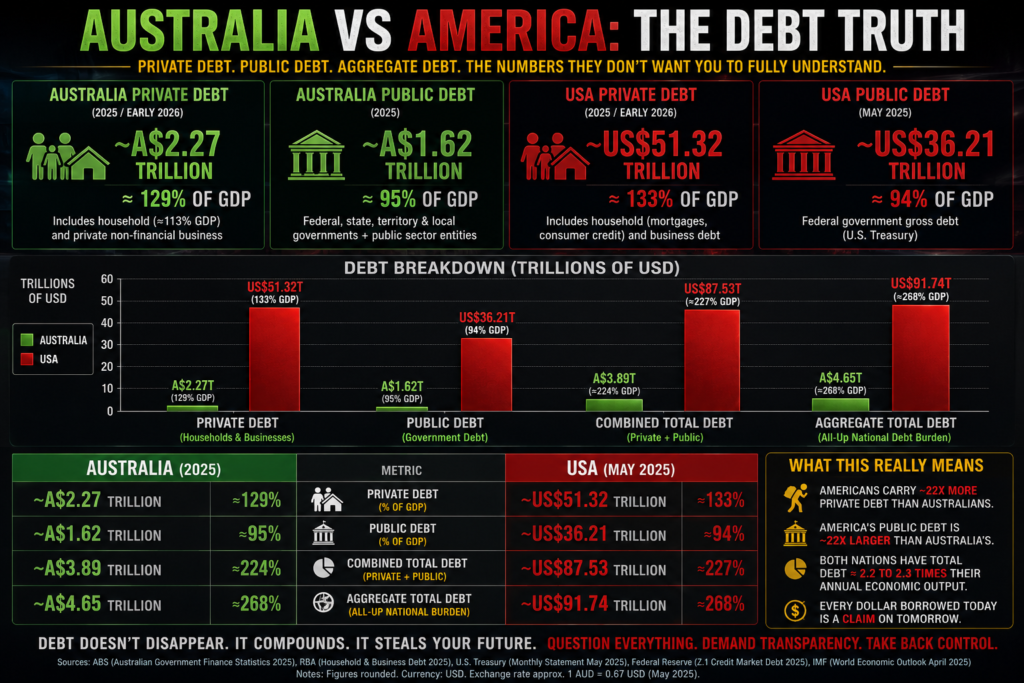
When public and private debt are combined, Australia is carrying a national debt burden around 268% of GDP.
~268%
Public + private debt as a share of GDP.
The Trap Is Simple
The country borrows. The states borrow. Councils borrow. Public corporations borrow. Households borrow. Businesses borrow. Then the public is told the system is “strong” because asset prices are high and credit is still flowing.
But debt is not wealth. Debt is a claim on future labour, future taxes, future rates, future inflation, future land values and future obedience.
Every dollar borrowed today becomes someone else’s future obligation.
Who Borrows on Australia’s Behalf?
Commonwealth Government
Issues most federal debt through the Australian Office of Financial Management via Treasury Bonds, Indexed Bonds and Treasury Notes.
State Governments
NSW, Victoria, Queensland, WA, SA and Tasmania borrow for infrastructure, services, deficits and long-term commitments.
Territory Governments
ACT and NT borrow on a smaller scale, but still add to the national public-sector burden.
Local Governments
Councils and shires borrow for local infrastructure, with repayment pressure flowing through rates, fees and charges.
What $1.62 Trillion Actually Means
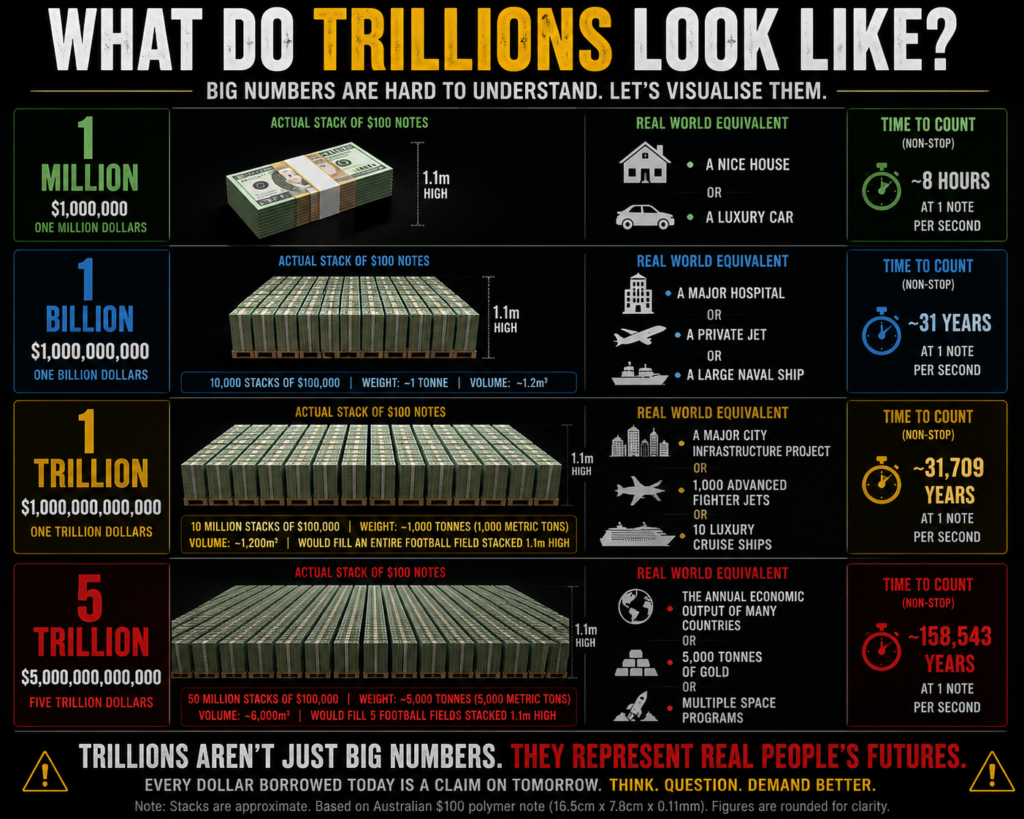
One trillion is one million millions. A trillion dollars is not a budget line. It is not an accounting mistake. It is a civilisation-scale claim.
$1,620,000,000,000
Approximate public-sector debt figure.
16.2 Billion
Equivalent number of $100 notes.
16,200
Stacks of $100 million each.
Debt Snapshot: Australia 2025 / Early 2026
| Category | Approximate Figure | Plain-English Meaning |
|---|---|---|
| Household Debt | ~113% of GDP | Mostly mortgage debt secured against residential land. |
| Total Private Debt | ~129% of GDP | Households and private non-financial business debt combined. |
| Public-Sector Debt | ~$1.62 trillion | Federal, state, territory, local and related public-sector borrowing. |
| Total National Debt Burden | ~268% of GDP | A debt load far larger than the annual output of the country. |
The Bill Always Comes Due
Debt is not free money. It is delayed extraction. It is paid through tax, inflation, higher rates, reduced services, land pressure, wage pressure, and the quiet transfer of future choice into present obligation.
Figures are rounded for public readability. Sources include ABS Government Finance Statistics, AOFM public debt information, BIS-linked household debt indicators and private-sector debt datasets.